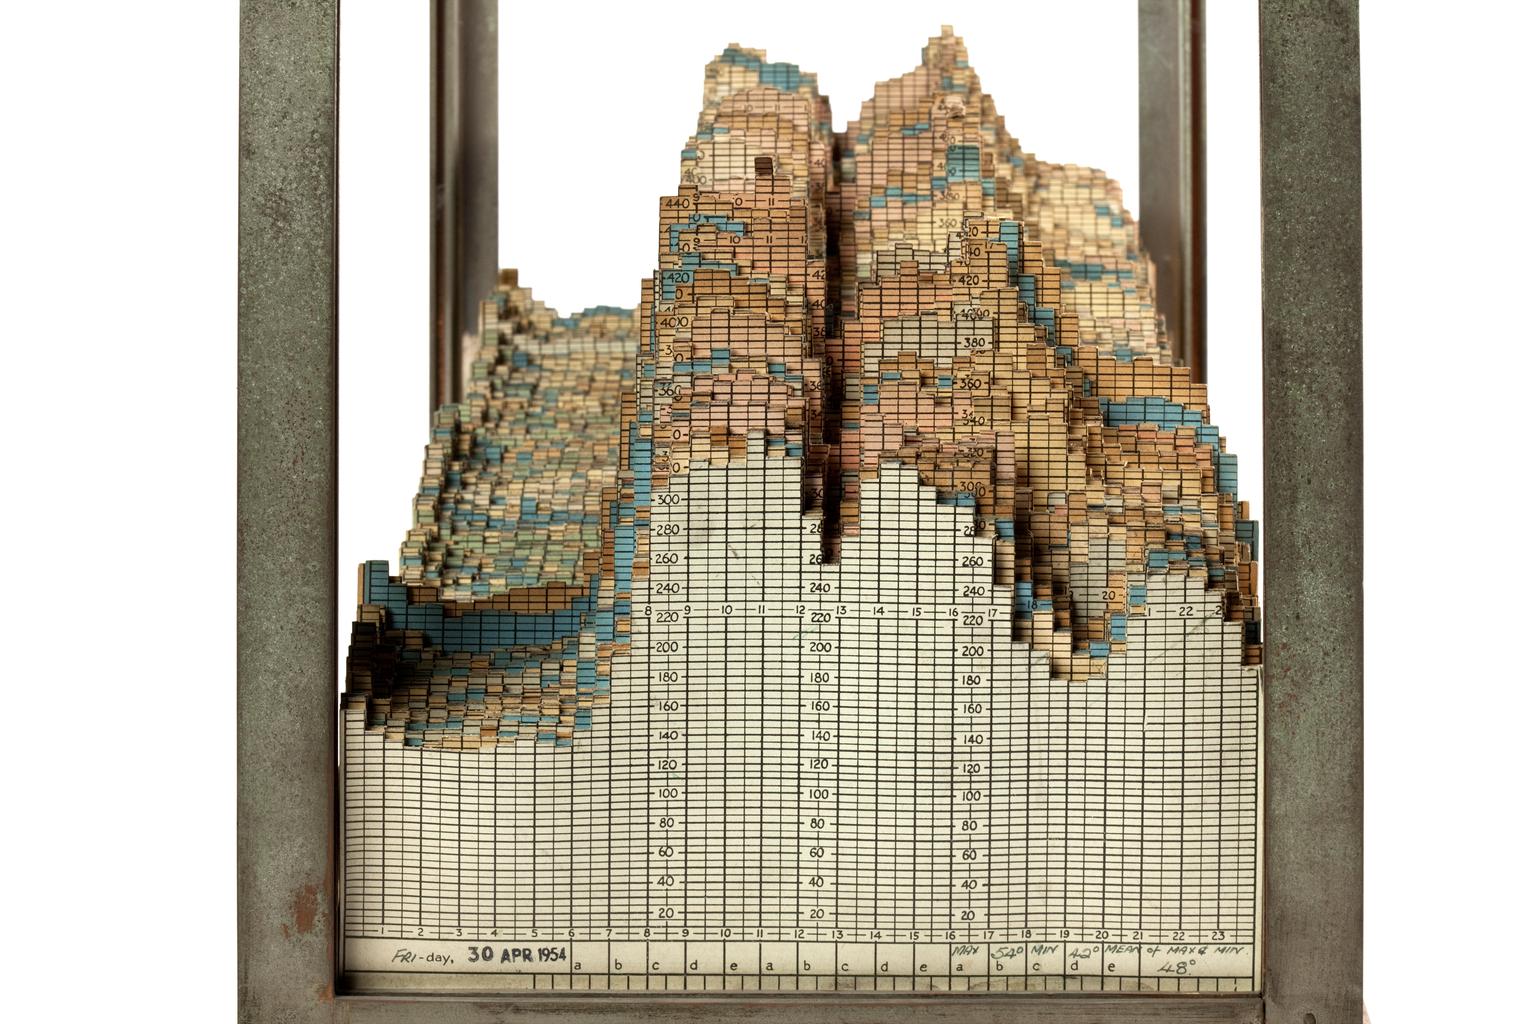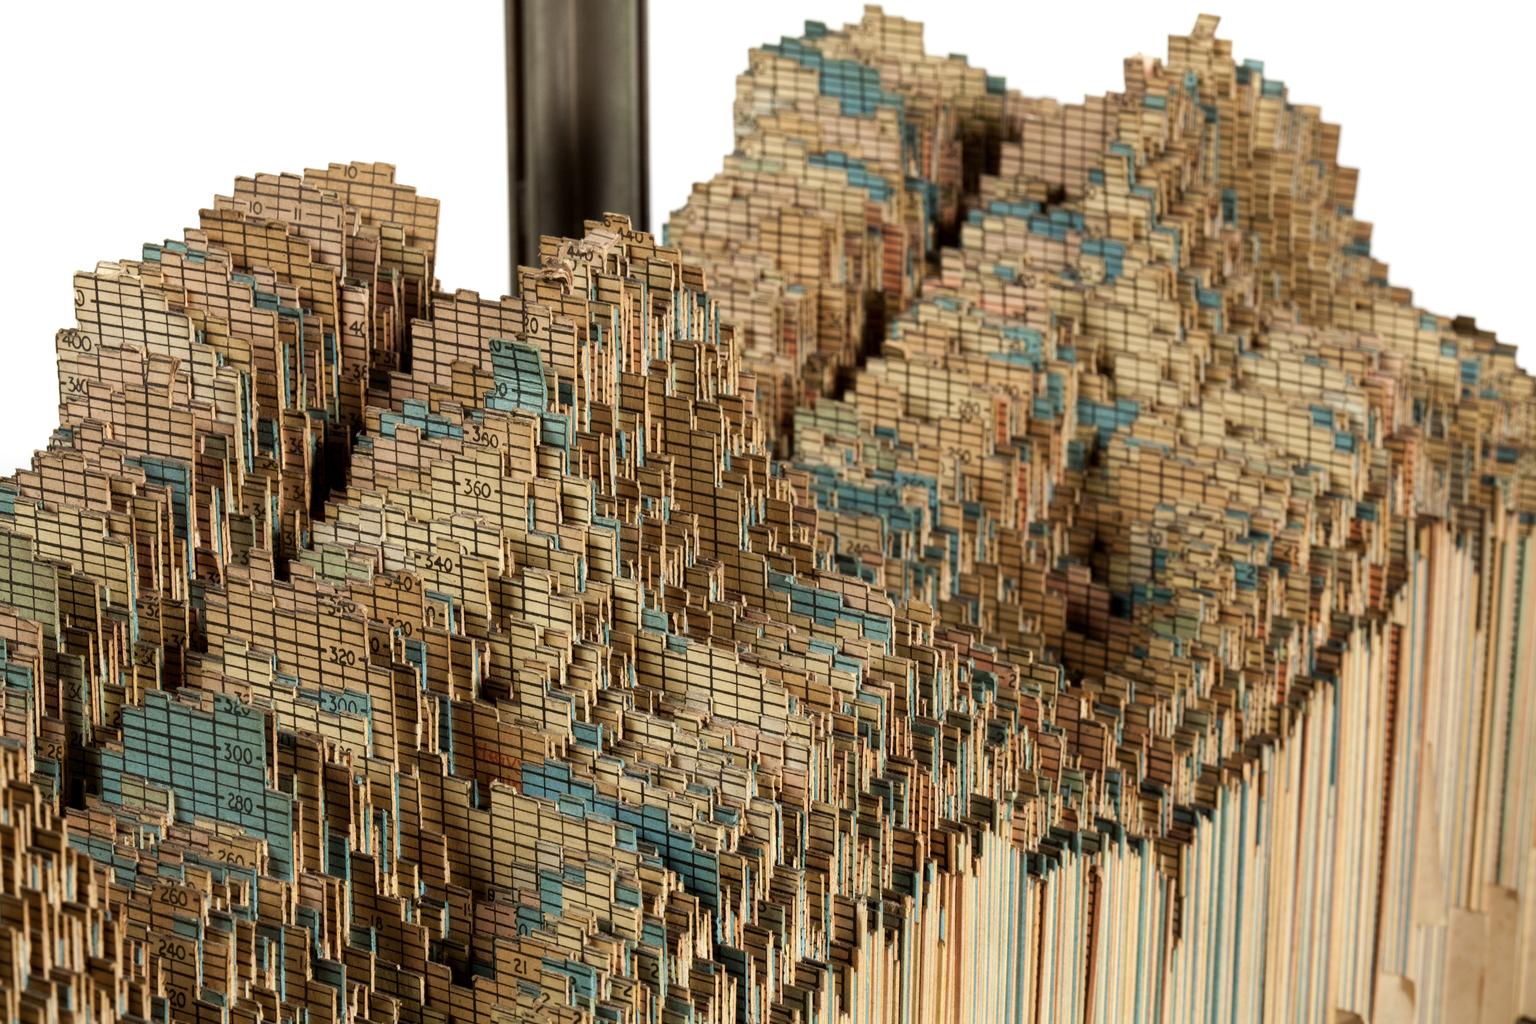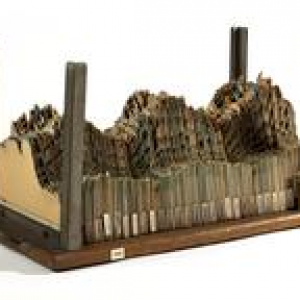
3d chart used by Central Electricity Generating Board planners, c.1954. Data represents electricity generation and demand over time (Oct ‘51 - Apr ‘54). More info: [collection.sciencemuseum.org.uk] h/t @astrolabe’s instagram, which always has the coolest stuff: [instagram.com]
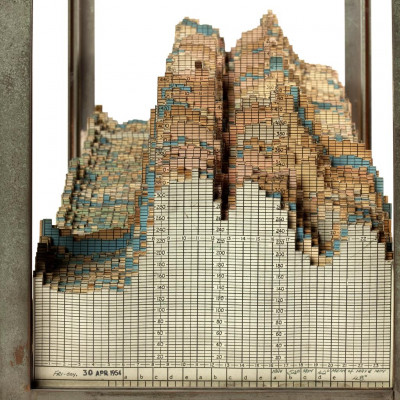
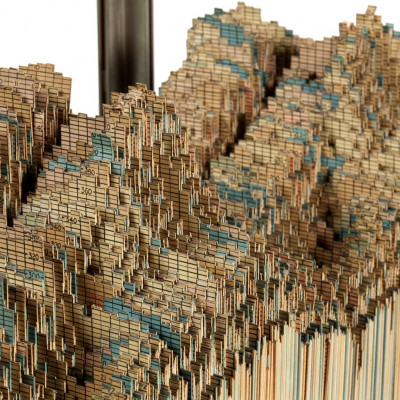
Three-dimensional Model of Electricity Consumption in Manchester | Science Museum Group Collection
Three-dimensional chart used by Central Electricity Generating Board, c.1954.
Login • Instagram
www.instagram.com
Want to know when I post new content to my blog? It's a simple as registering for free to an RSS aggregator (Feedly, NewsBlur, Inoreader, …) and adding www.garoo.net to your feeds (or www.garoo.net if you want to subscribe to all my topics). We don't need newsletters, and we don't need Twitter; RSS still exists.
Legal information: This blog is hosted par OVH, 2 rue Kellermann, 59100 Roubaix, France, www.ovhcloud.com.
Personal data about this blog's readers are not used nor transmitted to third-parties. Comment authors can request their deletion by e-mail.
All contents © the author or quoted under fair use.